Penda Science is a gamified online learning solution for grades 3 through biology that engages students with science activities that are handcrafted to Florida’s State Academic Science Standards (FL SASS). This study focuses on the use of Penda Science in Charter Schools USA (CSUSA), an education management company operating charter schools in seven states. In the 2020–2021 academic year, CSUSA began implementing the program in its Florida-based schools for supplemental science instruction and intervention in grades 3–biology.
NWEA’s MAP® Growth™ Science assessment was administered to 19,461 CSUSA students in grades 3–10 during the 2021–22 school year. The assessment was administered in the fall, again in the winter, and at the start of the spring semester. Results from the fall and spring assessments were analyzed with the goal of understanding whether Penda Science usage by 13,364 of the students positively impacted their science achievement.
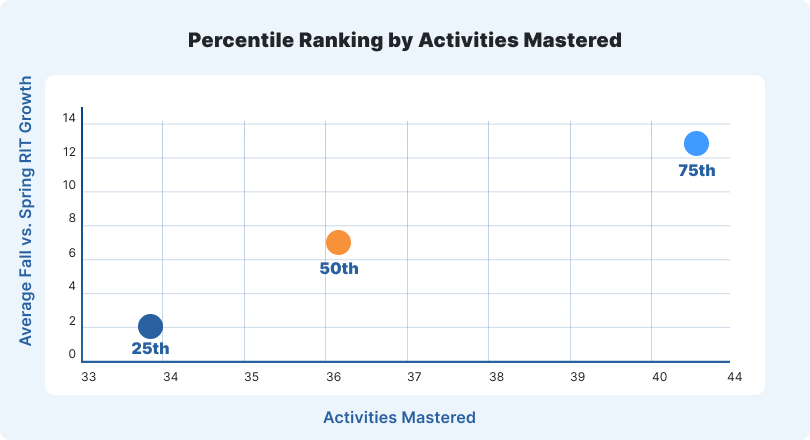
Results suggest that there was a significant and educationally-meaningful correlation in the science achievement of students, as measured by growth in NWEA RIT scores, who used the Penda Science program in the 2021–22 school year compared to students who did not use the program. Figure 4 shows how student science achievement increases as the number of Penda Science activities mastered increases. Students in the 25th percentile gained two points of RIT growth between fall and spring and on average mastered 34 activities. Students in the 50th percentile gained seven points of RIT growth and on average mastered 38 activities. Students in the 75th percentile gained 12 points of RIT growth and on average mastered 40 activities. Students in grades three through five who used Penda increased their MAP Science Growth scores 117.75% percent over the control group.
ALL STUDENTS deserve an opportunity to learn and love science. Standards-based and inclusive, Penda Science provides interactive, online science activities for grades 3 – high school that have been specifically crafted for Florida SASS, Texas TEKS, and NGSS performance expectations. Specifically tailored to district/organization science curricula, Penda activities are hand-aligned to the scope, sequence, and pacing, then auto-assigned (and auto-graded!) on a weekly basis to keep science instruction going, no matter the situation. High-quality science instruction for ALL students (especially struggling readers, Level 1’s and 2’s, and ELL/ESOL students) is possible since all activities contain a dynamic immersive reader (with read-aloud capability) and language translator tool (60+ languages).
Mini assessments (for every standard/performance expectation), course assessments, and high-stakes assessment prep activities provide teachers with high-quality, informative, research-based assessment tools to use for diagnostic, formative, or summative purposes. Assess student learning before differentiating instruction or providing timely intervention to address learning gaps––all possible with Penda Science! Teacher tested, student approved––it won’t be long before students are asking for more science work since Penda’s student experience is built upon exciting gamification elements. Activity and experience points, levels, leaderboards, achievement items (digital badges), streaks, challenges (weekly, monthly, class/grade/school), an online store to purchase items to customize the student’s avatar, an avatar customization studio, and unlockable rewards have students motivated and empowered to spend more time practicing and mastering science standards.
CSUSA, founded by Jonathan Hage in 1997, is one of the largest and highest performing education management companies in the United States, serving over 75,000 students at 87 schools in seven states. It operates 58 charter schools in the state of Florida. CSUSA ’s innovative educational approach includes advanced technology, meaningful parental involvement, student uniforms, consistent and fairly-enforced discipline policies, highly qualified and motivated staff, community focus, and integrated character education.
The CSUSA Educational Model teaches state standards through a Guaranteed and Viable Curriculum (GVC). Each school uses approved textbooks, technology, and literary resources to ensure students master the standards. The CSUSA Educational Model is based on Robert J. Marzano’s What Works in Schools. The GVC ensures academic excellence in every classroom and encourages steady academic progress toward mastery of state standards as students build their knowledge and skills from one year to the next.
CSUSA began piloting and implementing Penda Science in their Florida schools during the 2020–2021 academic year. By the 2021–22 school year, 49 of 58 CSUSA’s institutions in Florida used Penda Science.
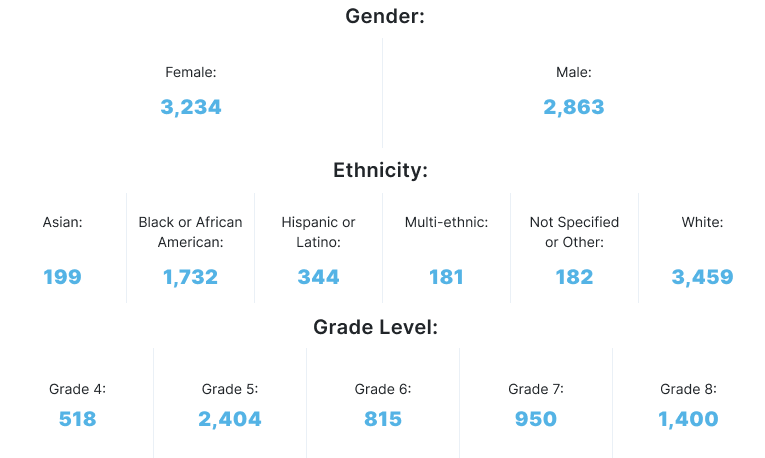
During the 2021–22 school year, which is the focus of this study, 6,097 CSUSA students in grades 3–biology in Florida used Penda Science as a science instruction and intervention. Student usage ranged from mastery of just a few activities to more than 300 activities. A “mastered activity” is defined as one in which the student answered between 80–100 percent of the questions correctly.


The study was conducted using a Pearson 2-tailed correlation statistical analysis. The term “Pearson 2-tailed correlation” refers to a statistical analysis that examines the relationship between two variables using Pearson’s correlation coefficient and involves a two-tailed hypothesis test.
Pearson’s correlation coefficient (often denoted as r) is a measure of the strength and direction of the linear relationship between two continuous variables. It ranges from -1 to +1, where -1 indicates a perfect negative linear relationship, +1 indicates a perfect positive linear relationship, and 0 indicates no linear relationship.
A two-tailed hypothesis test is used to determine whether there is a statistically significant correlation between the two variables. In a two-tailed test, the alternative hypothesis is that there is a correlation (either positive or negative) between the variables, while the null hypothesis is that there is no correlation.
The term “two-tailed” refers to the fact that the test considers both positive and negative correlations. The p-value associated with the test indicates the probability of observing a correlation as extreme as the one calculated from the sample data, assuming the null hypothesis is true. If the p-value is below a predetermined significance level (e.g., 0.05), it suggests that the correlation is statistically significant, and we reject the null hypothesis in favor of the alternative hypothesis.
Overall, a Pearson 2-tailed correlation analysis helps determine the strength and significance of the linear relationship between two variables.
Students’ scores from the fall of 2021 and spring 2022 administration of MAP Growth Science assessment were used as the measure of science achievement. MAP Growth Science is an adaptive computerized test developed by the not-for-profit organization NWEA (Northwest Evaluation Association). The assessment consists of 43 test items. The test pools are composed of items aligned to state standards. It is an untimed test but takes 45–55 minutes to complete.
MAP Growth is widely used in schools and educational institutions to assess students from kindergarten through grade 12. It is considered a formative assessment tool, which means it is administered periodically throughout the academic year to track students’ progress. By administering the assessment multiple times during the academic year, (fall, winter, spring) educators can track individual students’ growth and evaluate the effectiveness of instruction and interventions.
MAP results are evaluated using the RIT (Rasch UnIT) measurement scale, which was developed to simplify the interpretation of test scores. RIT is an equal-interval measurement scale, ranging from 100–350.
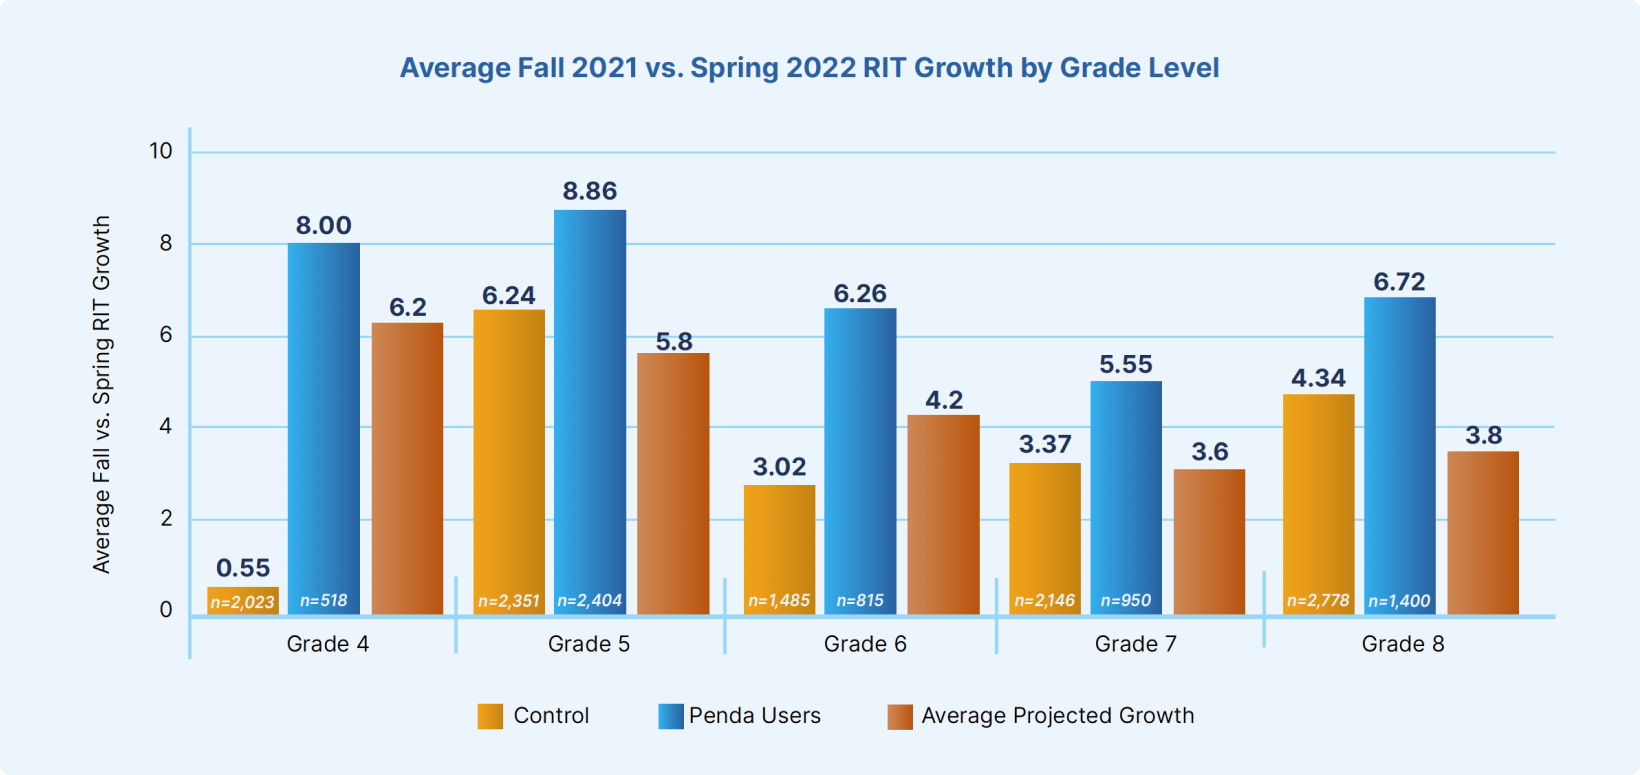
RIT scores, as measured in fall 2021 and again in spring 2022, showed the following average differences in gains by students who used the Penda Science program versus those who did not:
Grades 4–5: Penda users achieved 10.07 points additional growth in MAP Growth Science scores from fall to spring, which equates to a 148.31 percent increase over the control group.
Control Group: The control group, consisting of 4,374 students, had an average growth of 3.39 points from fall to spring.
Penda Users Group: The Penda users group, comprising 2,922 students, had a higher average growth of 8.43 points from fall to spring. This indicates that, on average, students in the Penda group demonstrated greater improvement in their scores compared to the control group.
The difference between the two groups, which is 8.43–3.39 = 5.04 points, represents the gap in average growth between them.
Other grade bands also showed that the average growth of Penda users was greater than that of the control group:
Grades 6–8:
7.80 points more growth, 72.69 percent increase over the control group.
The difference between the two groups, which is 8.43–3.39 = 5.04 points, represents the gap in average growth between them. Other grade bands also showed that the average growth of Penda users was greater than that of the control group: Grades 6–8: 7.80 points more growth, 72.69 percent increase over the control group. These findings show that across all grade levels, students who used Penda Science exhibited a larger average growth in RIT scores compared to the control group, and compared to the organization’s projected growth over the fall-to-spring period. The growth was most significant in grades 4–5.
The number of activities mastered by students within Penda Science were tracked as part of this study. The 6,097 students who used Penda Science collectively mastered (defined as achieving a score of 80 percent or higher) a total of 186,119 activities during the 2021–2022 academic year.
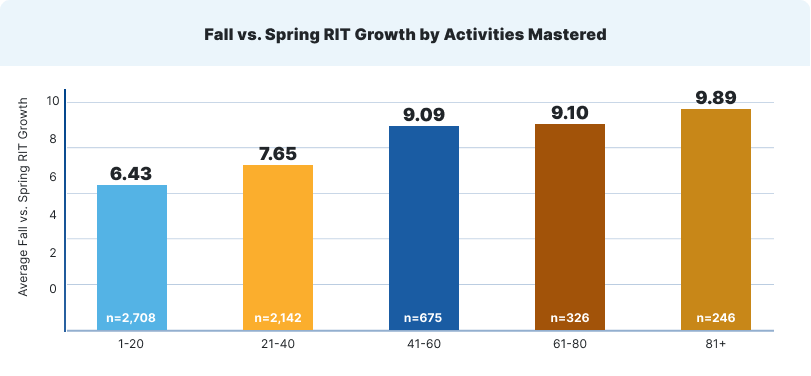
The data suggest that as the number of activities mastered increases, the average RIT growth also tends to increase.
The 2,708 students who mastered between 1–20 activities showed an average fall-to-spring test RIT growth of 6.43 points. The 2,142 students who mastered between 21–40 activities showed an average growth of 7.65 points. The 675 students who mastered between 41–60 activities showed an average growth of 9.09 points. The 326 students who mastered between 61–80 activities showed an average growth of 9.10 points. And finally, the 246 students who mastered more than 81 activities showed an average growth of 9.89 points.
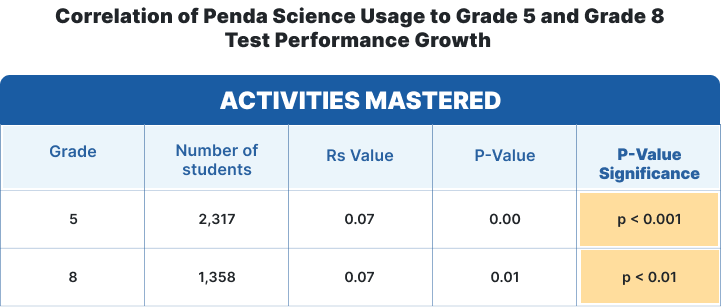
The study used a Pearson 2-tailed correlation statistical analysis to evaluate performance growth by Penda users across the grade levels. In Table 1, below, “Rs value” refers to the correlation coefficient (also known as Pearson’s correlation coefficient) between two variables. It measures the strength and direction of the linear relationship between two variables. The value ranges from -1 to 1, where -1 indicates a strong negative correlation, 1 indicates a strong positive correlation, and 0 indicates no linear correlation.
“P-value” (also referred to as the probability value) represents the statistical significance of the correlation coefficient. In general, a smaller p-value suggests stronger evidence against the null hypothesis of no correlation.
Analysis for grades 5 and 8 are highlighted because students in these two grades went on to take the Florida Statewide Science Assessment (SSA).
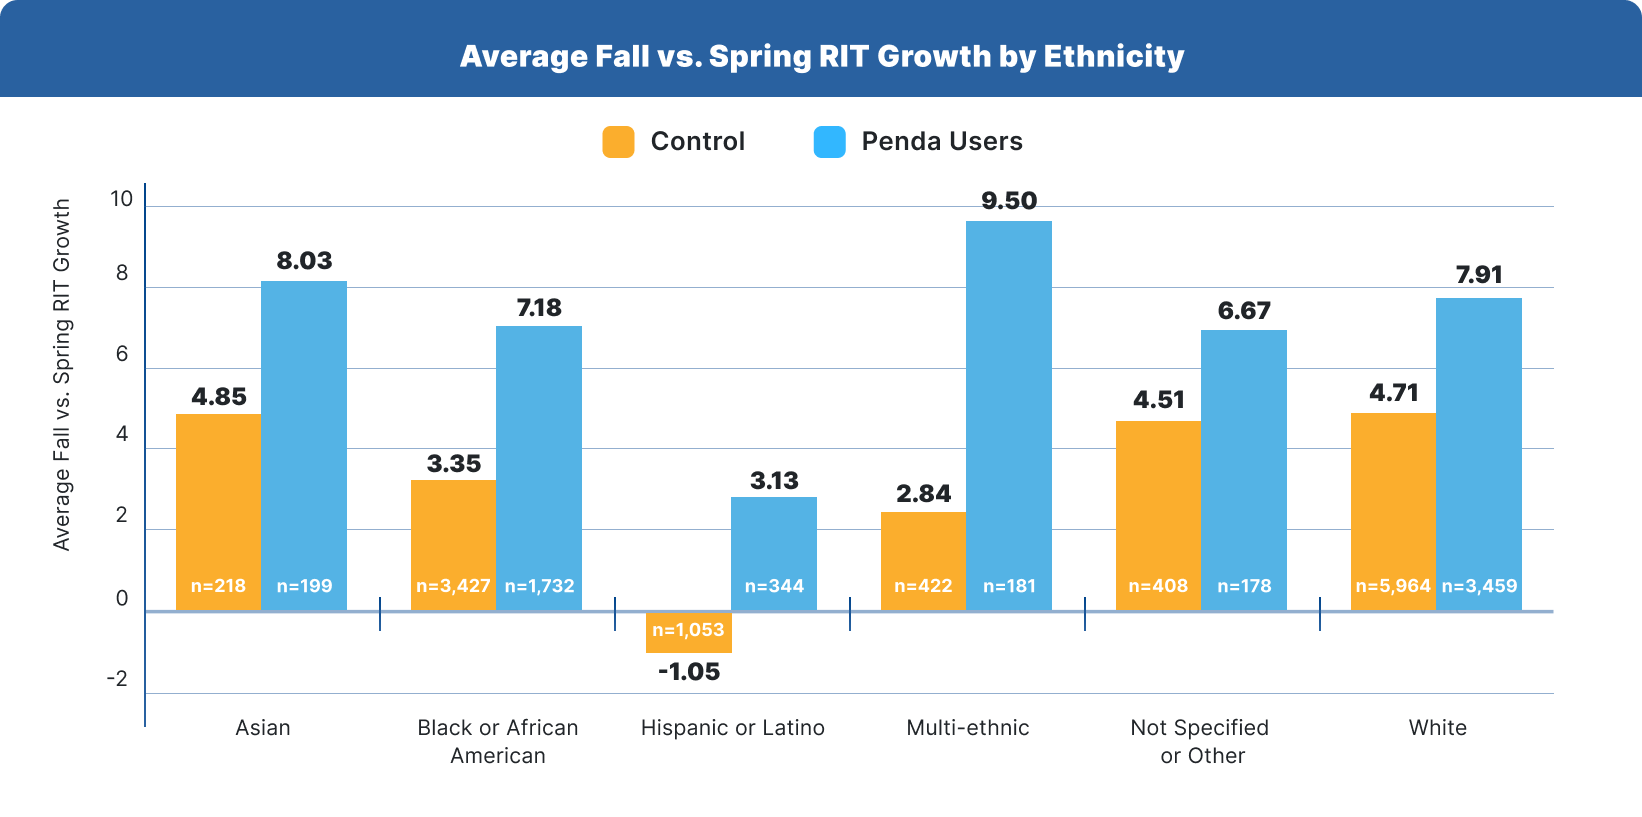
The study took into account the ethnicities reported of the students who used Penda Science as well as those in the control group. Below is a summary of the average RIT growth values for each ethnic group
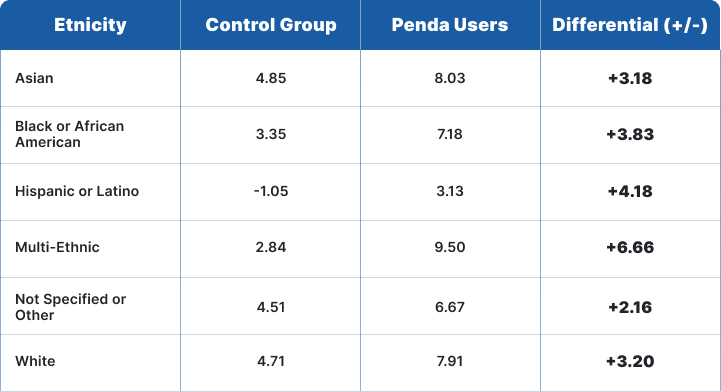
The positive differentials for all ethnicities suggest that Penda users, on average, exhibit higher growth in RIT scores compared to the control group. This indicates a potential positive impact of Penda usage on ensuring educational equity and closing the achievement gap.
The magnitude of the differential varies across ethnicities. For example, American Indian or Alaska Native, Multi-ethnic, and Hispanic or Latino students demonstrate larger differentials, indicating a potentially higher impact of Penda usage on their RIT growth. On the other hand, Asian and White students show smaller differentials. In fact, White and Not Specified showed the smallest differentials between the control group and Penda Users, suggesting that Penda has a significant impact on the learning growth of historically marginalized student groups.
It is important to note the sample sizes (n) provided for each ethnicity. Larger sample sizes generally provide more reliable insights. In this dataset, the sample size for White students is significantly larger (5,964 control group/3,459 Penda users) compared to the other ethnicities.
While the differentials do suggest a positive association between Penda usage and RIT growth, it is important to consider factors such as demographics and other variables that might influence the results.
The study examined students’ percentile rankings against their RIT growth from fall to spring, cross referenced against the number of Penda Science activities they mastered. Students in the 25th percentile showed two points of RIT growth between fall and spring, and those students on average mastered approximately 34 activities. Students in the 50th percentile showed approximately seven points of RIT growth between fall and spring, and those students on average mastered approximately 36 activities. Students in the 75th percentile mastered approximately 43 activities (just seven more than their peers in the 50th percentile), and this group of students showed a 6 point RIT growth increase between fall and spring over their 50th percentile peers.
This data suggest a correlation between the number of Penda Science activities mastered and academic growth. Students who engaged more with the activities tended to show higher levels of growth in their academic performance, as reflected by their RIT scores.
This was an observational study. Usage of Penda Science was dependent on whether or not teachers chose to adopt the program in their classrooms; thus, control group students and Penda users were not specifically selected. Even among those teachers who adopted Penda, usage and implementation fidelity varied. Some teachers who gained access to Penda attended professional development on the program while other teachers with Penda access did not complete the professional development sessions, and therefore may not have implemented Penda with fidelity. Even among those teachers who adopted Penda and/or attended professional development, implementation and usage with fidelity varied.
Some schools used Penda as a supplement to whole class instruction led by a teacher. Other schools relied on Penda to provide all science instruction to students due to teacher vacancies, long-term substitute teachers, teachers who were out-of-field or had never taught before. In addition, there were wide variations in the numbers of students per grade level who were exposed to Penda, in the levels of student usage, and in the total number of activities mastered
As a result, this study can only describe the association between Penda Science usage levels and science achievement and cannot make any causal claims that the differences in science achievement definitively are caused by use of the Penda Science program.
The results of this study indicated a promising association between Penda Science program usage and science achievement, as shown by growth in RIT scores from fall to spring in the 2021–2022 academic year. Additional investigation is warranted through the implementation of a randomized controlled trial (RCT) or a meticulously designed quasi-experimental (QED) research study. This would help minimize disparities between students who engage with Penda Science and those who do not, leading to a more comprehensive understanding.
Additionally, as the integration of Penda Science expands among science
educators, future studies can incorporate a larger cohort of students,
including those with higher levels of usage. This expanded sample size
would enable a more reliable assessment of whether the relationships
observed in this study persist across a broader population.


